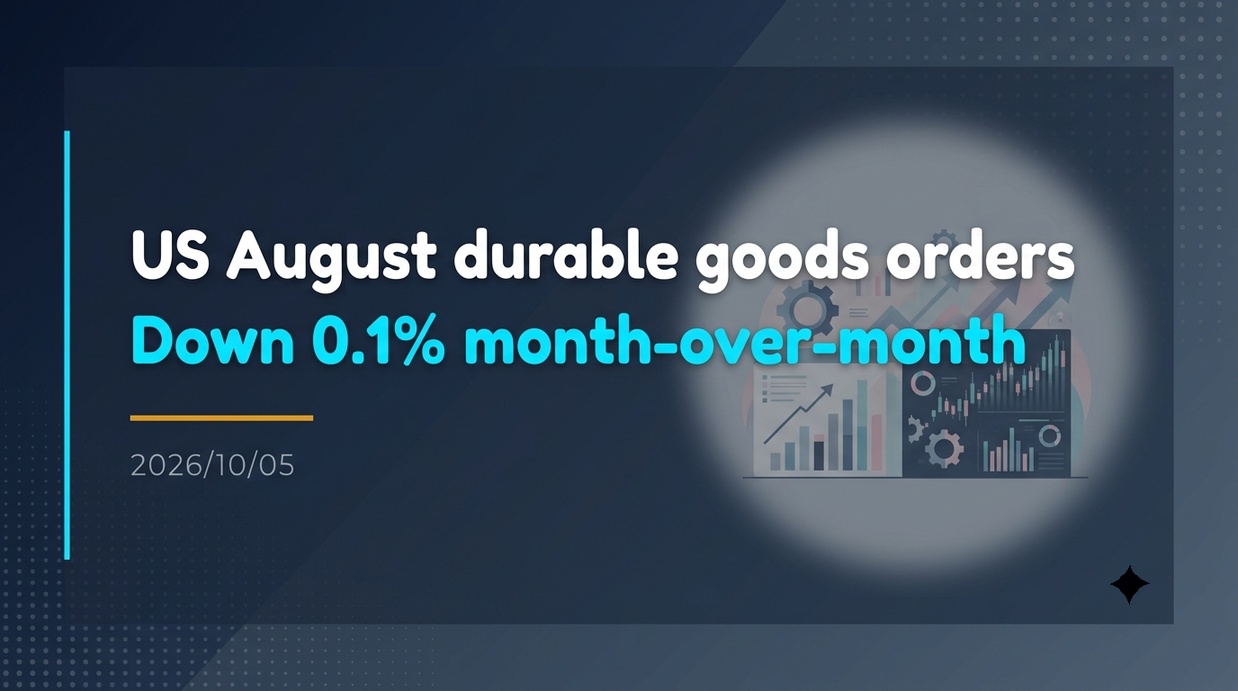
In August 2026, U.S. durable goods orders decreased by 0.1% from the previous month (downwardly revised in the final figures from the preliminary reading of 0.0% flat), coming in below market expectations. On the other hand, orders for non-defense capital goods excluding aircraft (core capital goods), which serve as a leading indicator for corporate capital expenditure, grew strongly by 1.6% month-on-month. This highlights a duality: a surface-level slowdown driven by fluctuations in transportation equipment, alongside robust, domestic-demand-driven willingness to invest in business equipment.
- Key Points and Major Numerical Trends in August US Durable Goods Orders
- The contrasting movements of transportation equipment slumps and core indices
- Expansion of AI Infrastructure Demand and the Broadening Base of Capital Investment
- Impact on Financial Markets and Reactions of Interest Rates and Foreign Exchange
- The Discrepancy Between Nominal and Real AI-Related Investments and Challenges in Substantive Investment
- Outlook for the US Economy and Key Points for Investment Decisions
Key Points and Major Numerical Trends in August US Durable Goods Orders
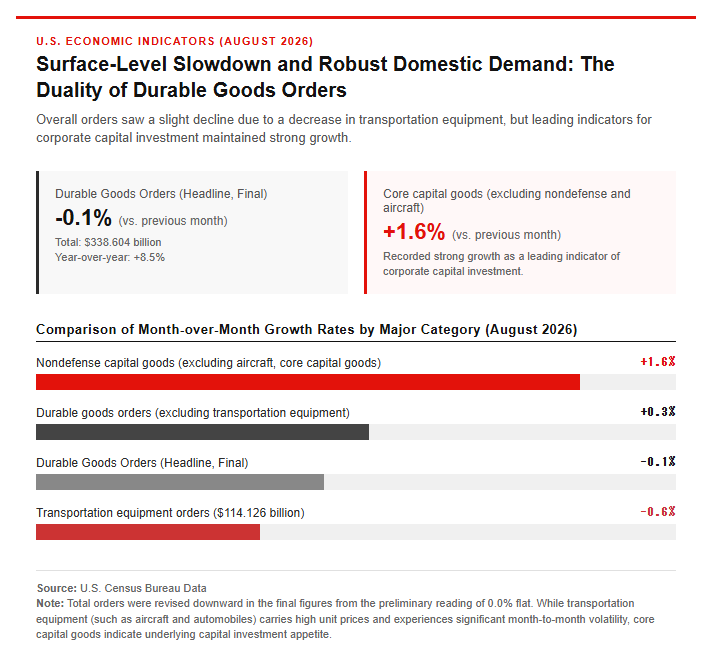
According to durable goods orders statistics for August 2026 released by the U.S. Census Bureau, total new orders for durable goods in the manufacturing sector decreased by 0.1% month-on-month on a seasonally adjusted basis, amounting to $338.604 billion. While the preliminary figures had reported a flat 0.0% month-on-month change, the final figures were downwardly revised, shifting into negative territory for the first time since May 2026. Given that the previous month of July 2026 saw a 0.9% month-on-month increase, overall growth has temporarily stalled.
What stands out most in the latest statistics is the significant gap between the sluggish growth of the headline composite index and the breakdown data reflecting the actual state of corporate activity. The overall figures for durable goods orders are characterized by being heavily influenced by transportation equipment, such as aircraft and automobiles, which feature exceptionally high unit prices and volatile month-to-month swings. August orders for transportation equipment fell 0.6% from the previous month to $114.126 billion, serving as the primary factor that significantly dragged down the overall index.
In contrast, core durable goods orders excluding transportation equipment remained in positive territory, up 0.3% from the previous month (a 0.2% increase in the final figures). Furthermore, looking at the year-over-year figures, total orders increased by 8.5% and orders excluding transportation equipment rose by 11.2%, confirming that the medium- to long-term trend continues to maintain a high growth pace. Please refer to the graph below.
The contrasting movements of transportation equipment slumps and core indices
Looking at the breakdown of the transportation equipment sector, which was the largest downward factor on the headline index, civil aircraft and parts fell 4.3% from the previous month, and motor vehicles and parts declined 0.6%, with major categories all turning downward. Civil aircraft have a tendency for monthly figures to fluctuate wildly depending on the timing of large orders, and the August decline was a reaction to the significant 12.0% month-on-month growth seen in July.
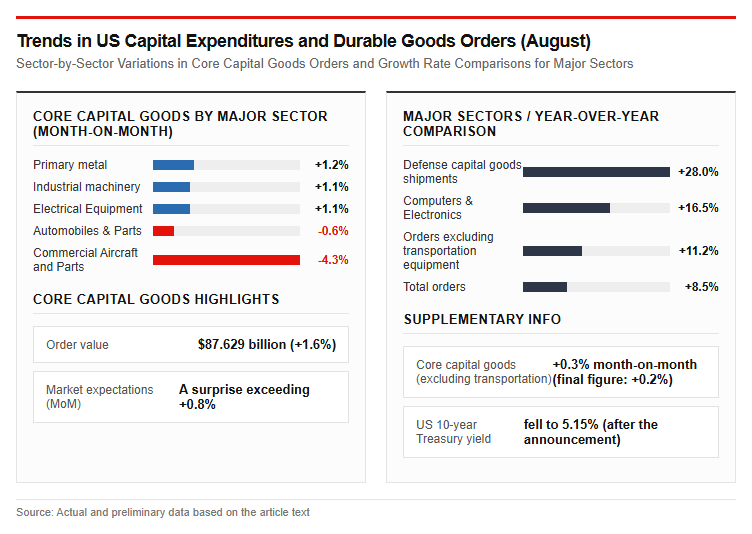
Meanwhile, orders for non-defense capital goods excluding aircraft, which indicate companies’ future production capacity expansion, reached $87.629 billion, a 1.6% increase from the previous month. This came as a significant positive surprise, well above the market expectation of a 0.8% month-on-month increase, and showed further acceleration from the revised July data (a 0.6% increase from the previous month).
Looking at core capital goods orders by sector, primary metals increased by 1.2% month-on-month, industrial machinery grew by 1.1%, and electrical equipment rose by 1.1%, showing that orders are expanding across a broad range of sectors underpinning the manufacturing base. Additionally, core capital goods shipments—which are used directly in estimating business investment for Gross Domestic Product (GDP)—also maintained growth at 0.6% month-on-month (a 0.5% increase in the final figures), suggesting that business investment will make a strong contribution to U.S. real GDP growth for the July–September (third quarter) 2026 period.
Background of Capital Investment and Spillover Effects on Financial Markets
Expansion of AI Infrastructure Demand and the Broadening Base of Capital Investment
The solid performance of capital investment by U.S. companies is driven by massive, rapidly accelerating investments in artificial intelligence (AI)-related infrastructure. With the construction of data centers and the introduction of high-performance servers, demand remains high for electrical equipment such as electric wires and transformers, industrial machinery essential for cooling systems, and metals used as building materials. Although orders for computers and electronic products remained flat at 0.0% month-on-month, they showed a 16.5% year-on-year increase—the highest growth rate in the past 20 years—with AI demand acting as a key supporting pillar.
Furthermore, signs of recovery are also emerging in traditional capital investment outside of the AI sector. Tax-based investment support measures, such as the reinstatement of 100% bonus depreciation under the tax cut bill (OBBBA) enacted in July 2025, began to make a full-fledged contribution entering 2026. In addition, the easing of uncertainty surrounding trade policy and the promotion of supply chain reshoring are also supporting corporate investment decisions.
In addition, the expansion of defense-related demand is a factor that cannot be ignored. Driven by changes in the security environment, shipments of defense capital goods have increased significantly by 28.0% year-on-year, indicating that the scope of investment is broadening not only in the high-tech sector but also across a wide range of sectors, including heavy industry and the defense industry.
Impact on Financial Markets and Reactions of Interest Rates and Foreign Exchange
Following the downward revision of the final August US durable goods orders to a 0.1% decline month-on-month from the preliminary figure, financial markets reacted by slightly easing caution over the overheating US economy. Following the release of the indicator, the US 10-year Treasury yield fell to the 5.15% level, and its upward momentum was curbed, with subsequent recoveries staying limited to 5.19%. Amid the drop in yields, selling of the dollar initially dominated the foreign exchange market, and although the US dollar-yen exchange rate rebounded from 156.95 yen to the mid-157 yen range, it faced a heavy upside. Please refer to the figure below.
The reason the market’s reaction remained limited is that while headline orders fell on the surface, underlying economic indicators used to assess the economy, such as core capital goods orders and shipments, showed strength. Even as long-term interest rates remain at high levels exceeding 5%, U.S. corporate investment demand is extremely robust, creating an environment where a rapid rate-cut scenario premised on an economic slowdown is likely to recede.
Regarding the monetary policy of the Federal Reserve Board (FRB), while the overheating of the labor market is showing signs of gradually subsiding, the strength of broad-based capital investment is being recognized as a matter of concern that is increasing inflation stickiness. The fact that corporations are accelerating investment even as a prolonged high-interest-rate environment is anticipated serves as evidence telling of the resilience of the U.S. economy.
Structural Changes in AI Investment and Future Outlook
The Discrepancy Between Nominal and Real AI-Related Investments and Challenges in Substantive Investment
In the AI-related sector driving current capital expenditures, a phenomenon known as the “divergence between nominal and real values” has been drawing close attention in recent years. While investment amounts on a nominal basis remain at high levels, a slowdown has been observed in real-basis investment amounts, which exclude the effects of price fluctuations. This is primarily caused by soaring prices for hardware components such as semiconductor memory, meaning that despite the increase in the amounts corporations are paying, the pace of increase in physical quantities—such as the number of servers actually being introduced—is beginning to plateau.
This kind of divergence between nominal and real terms has a positive aspect for the short-term performance of semiconductor and tech companies. This is because the stock market tends to evaluate nominal sales and earnings environments rather than actual physical volume. However, if the stagnation in real-term deployment volumes persists for a prolonged period, it carries the risk of eventually exerting downward pressure on nominal investment figures and corporate earnings through slumping component prices.
Another important point is that the bottleneck in AI investment is shifting from semiconductors themselves to securing electricity to run data centers and the costs of financing. Companies are being forced to allocate their limited funds not only to AI-related initiatives but also to energy supply and peripheral infrastructure, leading to a stricter evaluation of investment efficiency.
Outlook for the US Economy and Key Points for Investment Decisions
When forecasting the future outlook of the U.S. economy and manufacturing sector, the primary focus is whether the order and shipment trends for core capital goods can maintain their upward trajectory. Through primary statistics such as the preliminary September durable goods orders report scheduled for release on October 27, 2026, and the subsequently announced finalized GDP figures, it will be necessary to carefully assess the sustainability of capital investment.
It is important not to be misled solely by the headline indicating a month-on-month decline in the headline index, but to closely examine the dynamics of structural change. The key to grasping the current position of the business cycle is to analyze how much new investment companies are making on a basis excluding temporary and highly volatile factors such as transportation equipment, and whether those orders are steadily being fed back into the real economy as “shipments.”
Furthermore, close attention must continue to be paid to the cumulative impact of the high-interest-rate environment on corporate management, as well as developments in the U.S. presidential election and tariff policies, and trends in geopolitical risks including the situation in the Middle East. Whether corporate appetite for capital investment broadens further and continues to serve as a pillar supporting the U.S. economy’s soft landing and sustainable growth will likely dictate the overall trends of the financial markets going forward.
Reference Page
- [U.S. Census Bureau Manufacturers’ Shipments, Inventories, and Orders] https://www.census.gov/manufacturing/m3
【#USEconomy #DurableGoodsOrders #CapitalSpending #FRB #AIInvestments #Macroeconomy】

コメント