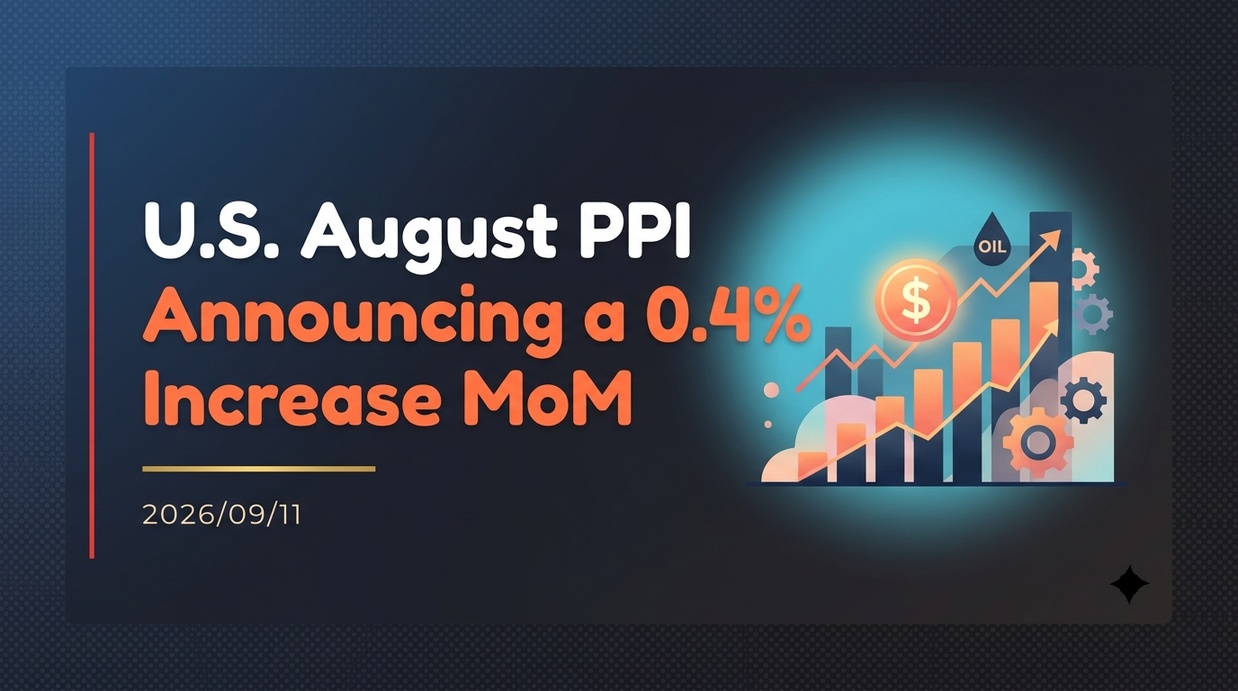
The U.S. Producer Price Index (PPI) for August 2026 rose 0.4% month-over-month and accelerated to a 5.4% year-over-year gain, surpassing market expectations. A sharp surge in energy prices driven by escalating U.S.-Iran geopolitical tensions served as the primary catalyst, fueling strong expectations of an imminent interest rate hike by the Federal Reserve.
- Month-over-Month Rise of 0.4% and Acceleration to 5.4% Year-over-Year
- Resurgent Energy Prices Behind a 1.1% Surge in Goods Prices
- The Ripple Effect of a 24.1% Diesel Spike on Logistics and Production Costs
- Muted Service Inflation and Divergence Across Sectors
- Spike in Fed Rate Hike Expectations and Financial Market Volatility
- Methodological Revisions to PCE Deflator and Upcoming Inflation Watchpoints
Month-over-Month Rise of 0.4% and Acceleration to 5.4% Year-over-Year
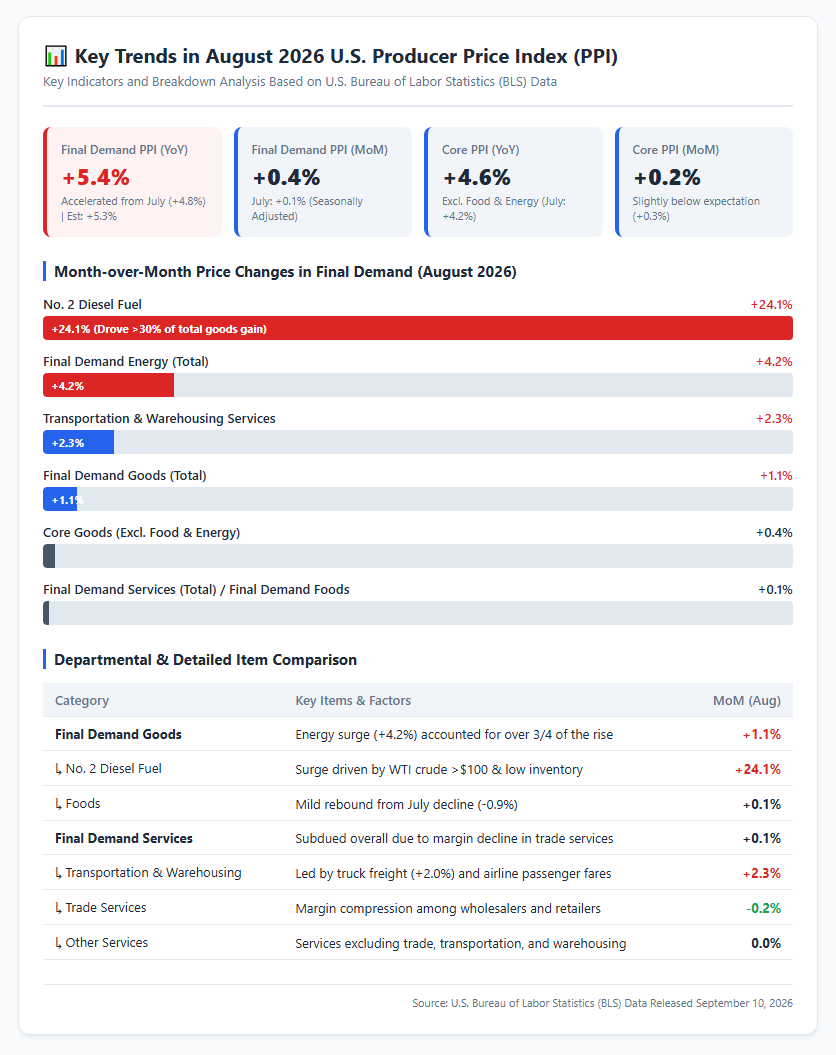
The U.S. Bureau of Labor Statistics (BLS) reported on September 10, 2026, that the Producer Price Index (PPI) for final demand rose 0.4% on a seasonally adjusted month-over-month basis in August 2026. This follows an upwardly revised 0.1% gain in July 2026, marking a clear expansion in price momentum. On an unadjusted basis, the final demand index advanced 5.4% over the 12 months ended in August, accelerating significantly from 4.8% in July 2026 and topping the market consensus estimate of 5.3%. Core PPI—which excludes volatile food and energy prices—rose 4.6% year-over-year, widening its gain from 4.2% in July 2026. On a monthly basis, core PPI edged up 0.2%, slightly below the market expectation of 0.3%. Nevertheless, overall producer inflation posted its fastest pace in months. A base effect—attributable to the 0.2% month-over-month decline in August 2025 falling out of the 12-month calculation—contributed approximately 0.6 percentage points to the year-over-year spike, but even accounting for this, the underlying data highlights reaccelerating inflationary pressure across the U.S. economy.
Resurgent Energy Prices Behind a 1.1% Surge in Goods Prices
A detailed breakdown of the August inflation data reveals that final demand goods prices surged 1.1% month-over-month, marking a sharp reversal after two consecutive monthly declines. More than three-fourths of this broad-based increase was driven by final demand energy prices, which jumped 4.2% in a single month. Heightened geopolitical tensions in the Middle East and renewed hostility between the U.S. and Iran pushed WTI crude oil futures past \$100 per barrel, directly sparking an energy market surge. In contrast, final demand food prices edged up a modest 0.1% month-over-month, registering a mild rebound from a 0.9% drop in July 2026. Final demand goods excluding food and energy rose 0.4% month-over-month. The steep increase in energy procurement costs presents an immediate cost burden across production floors in a wide array of industries. Please refer to the diagram below.
Structural Analysis of Inflation and Supply Chain Impact
The Ripple Effect of a 24.1% Diesel Spike on Logistics and Production Costs
The most prominent driver within final demand goods was a massive 24.1% month-over-month jump in No. 2 diesel fuel prices. The surge in diesel alone accounted for over a third of the total monthly increase in final demand goods prices. Alongside diesel, price indexes for gasoline, jet fuel, and home heating oil all recorded substantial gains. Retail diesel prices nationwide reached \$5.98 per gallon, compounding the burden amid multi-year seasonal inventory lows. Because diesel fuel is an indispensable input for long-distance trucking, construction equipment, and agricultural machinery, this surge immediately raised transport costs at the intermediate demand stage of processing. The rapid cost inflation felt by producers heightens the risk of pass-through into wholesale and retail shelf prices in the coming months.
Muted Service Inflation and Divergence Across Sectors
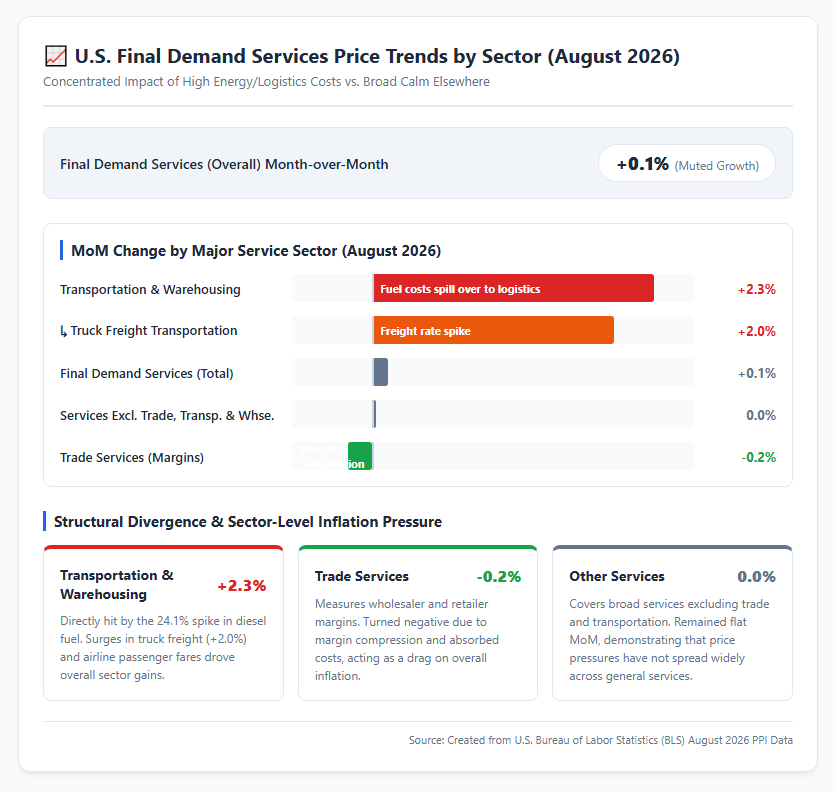
In contrast to the sharp surge in goods prices, final demand services prices edged up just 0.1% month-over-month in August 2026, indicating relative calm in the service sector overall. However, a look inside the service categories reveals stark sector-level divergence. Transportation and warehousing services—which directly absorb fuel cost pressures—rose 2.3% month-over-month, led by a 2.0% increase in truck transportation of freight as well as higher airline passenger fares. Conversely, trade services margins declined 0.2% month-over-month, while services excluding trade, transportation, and warehousing were flat (0.0%). Thus, as of August 2026, inflationary pressure was not spreading broadly across all services, but was instead heavily concentrated in specific sectors tied directly to energy and freight logistics. Please refer to the diagram below.
Monetary Policy, Market Re-pricing, and Key Watchpoints
Spike in Fed Rate Hike Expectations and Financial Market Volatility
With August PPI highlighting stubborn inflationary pressure, market expectations quickly shifted toward monetary tightening by the Federal Reserve at the upcoming Federal Open Market Committee (FOMC) meeting on September 15–16, 2026. According to market indicators such as the CME FedWatch tool, the probability of a 25-basis-point rate hike at the September FOMC rose from roughly 60%–65% before the release to 63%–70%, while a rate hike at the October meeting became fully priced in. Hawkish remarks by Fed Chair Kevin Warsh at the Jackson Hole symposium reinforced this outlook. Following the PPI announcement, risk-off sentiment swept financial markets: the 10-year U.S. Treasury yield climbed near 4.89%, approaching its highest levels since 2023, while the U.S. dollar strengthened, pushing USD/JPY into the 154 range. Meanwhile, Nasdaq-100 futures fell over 1%, and Bitcoin dropped to around \$77,050, reflecting widespread market re-pricing across asset classes.
Methodological Revisions to PCE Deflator and Upcoming Inflation Watchpoints
Starting with the August 2026 price statistics, the government is introducing important methodological changes to the Personal Consumption Expenditures (PCE) price index—the Fed’s preferred inflation gauge. Specifically, portfolio management and investment advice services, which have historically introduced volatility into PCE calculations, will be replaced with imputed measures. Additionally, new PPI-based estimation models will apply to legal services and computer software. This overhaul introduces additional uncertainty into how PPI data translates into core PCE inflation estimates, including historical revisions. Market focus is now turning to the August Consumer Price Index (CPI) report and the August PCE deflator release scheduled for September 30, 2026. A key question is whether the initial shock of surging energy prices will spill over into broader secondary inflation in wages and general services, making upcoming data releases crucial for shaping Fed policy and global market direction.
Reference Pages
- [Producer Price Index News Release – 2026 M08 Results – Bureau of Labor Statistics] https://www.bls.gov/news.release/ppi.htm
【#USEconomy #PPI #ProducerPriceIndex #Inflation #FederalReserve #MonetaryPolicy #CrudeOil #USDollar】


コメント