Amazon Web Services (AWS) has significantly enhanced the GPU anomaly detection and observability features in Amazon SageMaker HyperPod. The goal is to early identify and recover from slowdowns and silent failures occurring in specific GPUs or network links during distributed training of large language models and other workloads, thereby increasing the effective operating rate of clusters.
- The Challenge of Stragglers and Anomaly Detection Hindering Distributed Training
- A Dual Diagnostic Approach Combining Cross-Comparison and Static Rules
- GPU Cross-Comparison Mechanism via DetectGroupOutliers
- Static Rules Across Four Categories and Network Monitoring
- Load Control for Collected Metrics and CloudWatch Integration
- Improving uptime through verification of computation correctness and automated recovery
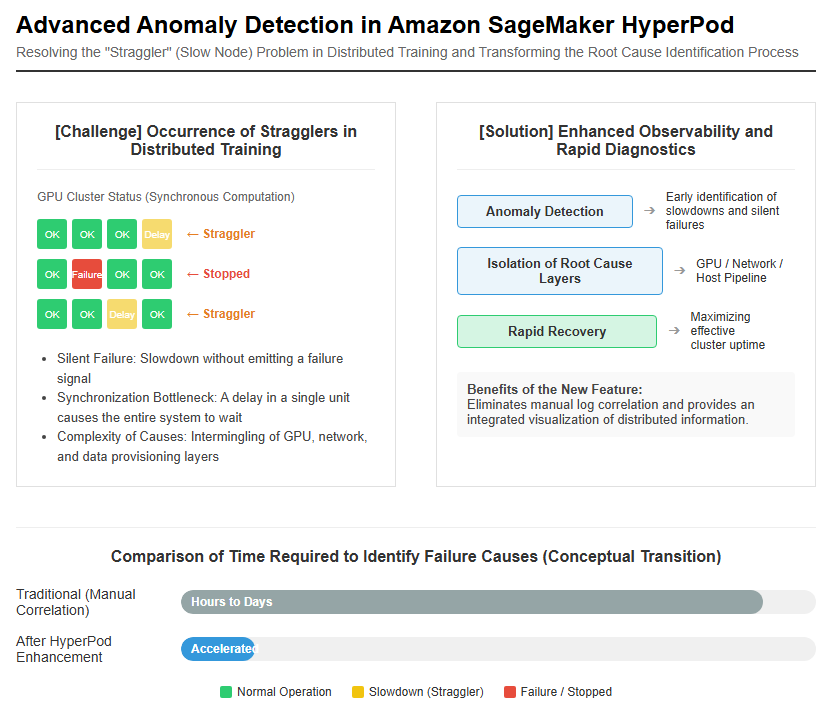
The Challenge of Stragglers and Anomaly Detection Hindering Distributed Training
In distributed training of large-scale AI models, thousands of GPUs compute while synchronizing with one another. If even a single GPU is slow in processing, the entire cluster enters a waiting state, wasting a vast amount of computational resources. Nodes with such slow processing are called stragglers, and because their operating speed drops without emitting hardware failure signals, discovering these faults has been extremely difficult. Reports from Meta on the training of the Llama 3 large language model also indicate that delays in specific workers or unexpected interruptions severely impacted overall progress. Conventionally, engineers had to manually cross-reference scattered logs and dashboards, taking hours to days to isolate whether the root cause of an issue was GPU thermal throttling, network bandwidth saturation, or a bottleneck in the data pipeline on the host. To address these challenges, AWS has improved the observability of Amazon SageMaker HyperPod and introduced new diagnostic capabilities that swiftly pinpoint the location and underlying layer of a failure.
A Dual Diagnostic Approach Combining Cross-Comparison and Static Rules
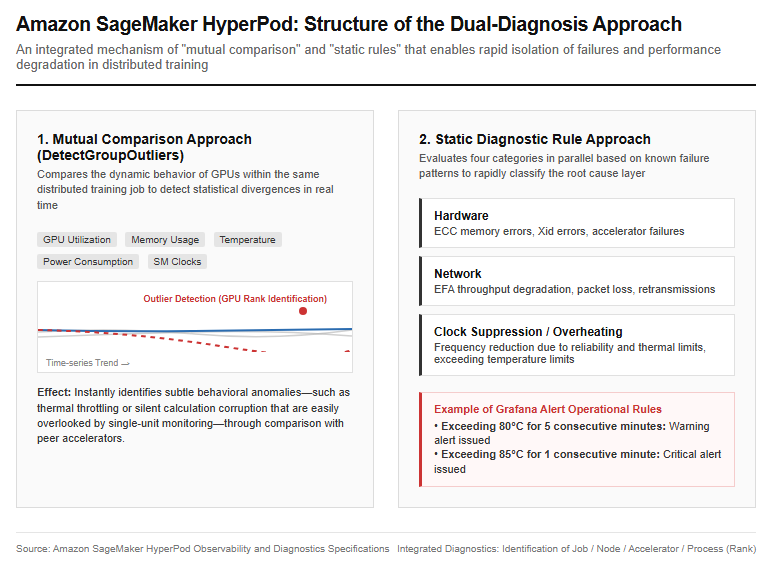
The core of the newly announced enhancements is the fusion of two approaches: “cross-comparison,” which compares the behaviors of a group of GPUs running within the same training job against one another, and “static rules,” which rely on accumulated historical failure patterns. Traditional agents that monitor only the hardware state of a single node were unable to capture issues where calculation results were silently corrupted or anomalies where processes remained running while effectively hung. In contrast, the new feature extracts dynamic statistical outliers in real time among accelerators executing the same job, while simultaneously evaluating known hardware and communication failure rules in parallel. This makes it possible to immediately correlate and visualize the specific job, node, accelerator, and process rank affected within a large-scale cluster.
Detailed Breakdown of Comparative Analysis via Five Metrics and Static Diagnostic Rules
GPU Cross-Comparison Mechanism via DetectGroupOutliers
The GPU cross-comparison feature utilizes the DetectGroupOutliers API in Amazon CloudWatch. This approach continuously compares five key metrics—GPU utilization, memory usage, temperature, power consumption, and the streaming multiprocessor operating frequency (SM clock)—across a group of GPUs participating in the same distributed training job. If a specific GPU deviates significantly from the average trajectory of its peer accelerators, the system immediately flags that GPU as an outlier. By detecting statistical outliers while taking context into account—such as the effects of dynamic voltage and frequency scaling caused by ambient temperature changes during the day, or differences in assigned workloads under pipeline parallelism—it highlights gradual performance degradation and abnormal behaviors that are easily missed by individual node monitoring.
Static Rules Across Four Categories and Network Monitoring
In the static diagnostic rules, detected failures are organized into four categories: hardware, network, clock throttling, and overheating. The hardware category targets GPU ECC memory errors, Xid error codes reported by NVIDIA drivers, and accelerator failures. The network category monitors throughput degradation, packet losses, and retransmissions in Elastic Fabric Adapter (EFA). The clock throttling category captures frequency drops associated with thermal and reliability constraints, while the overheating category detects states where pre-configured temperature limits are exceeded. For example, in a standard Grafana alert configuration, operational rules are built in to issue a warning if the GPU temperature exceeds 80°C for 5 minutes, and a critical alert if it exceeds 85°C for 1 minute.
Approach to Practical Implementation and Operational Significance
Load Control for Collected Metrics and CloudWatch Integration
When implementing the system, standard metrics are provided that automatically collect cluster health and OS/GPU resource usage every 30 seconds. The overhead associated with this collection process is kept to about 1–2% of CPU load and around 250–300 MB of memory consumption, minimizing the impact on training processes. Operators seeking more detailed analysis can optionally enable advanced metrics, including all indicators from NVIDIA DCGM and AWS Neuron, as well as detailed EFA communication metrics. The collected data is sent to the newly standardized CloudWatch SageMaker Insights, allowing for intuitive confirmation through four integrated views: diagnostic summary, hardware, workload, and network. Integration with traditional Prometheus and Amazon Managed Grafana also remains available as an option.
Improving uptime through verification of computation correctness and automated recovery
In addition to hardware health monitoring, countermeasures have been strengthened against silent data corruption—where computation results return incorrect values—and hang failures that cause jobs to stop. MultiNodeTrainingValidation, a pre-check test, runs a reference model when adding nodes to automatically verify whether NaN or infinite losses occur. Additionally, the hang detection feature for Slurm environments detects phenomena where GPUs stop outputting while retaining memory in about 15 minutes, automatically canceling and requeuing the job. Calculations show that if a hang occurs in a large-scale training job using 256 H100 GPUs, it takes 8 hours to discover manually, resulting in approximately $16,900 in losses, whereas automated detection can reduce this to about $530. Nodes where anomalies are detected are automatically excluded from allocation, and by coordinating with checkpoint-based recovery, the effective uptime (goodput) of the entire cluster can be significantly improved.
Reference Pages
- Introducing enhanced infrastructure observability in Amazon SageMaker HyperPod
- Introducing workload recovery and expanded infrastructure checks on Amazon SageMaker HyperPod
- Detecting and recovering from silent data corruption on Amazon SageMaker HyperPod
#AWS #SageMaker #HyperPod #GPU #AnomalyDetection #CloudWatch #LLM #MLOps

コメント