発表、コア前月比は0.3上昇_en.jpg)
The U.S. Bureau of Labor Statistics released the August 2026 Consumer Price Index (CPI), with core CPI rising 0.3% month-over-month, topping market forecasts. Driven by reaccelerating shelter costs and rising energy prices, the hotter-than-expected reading significantly bolstered expectations for a Federal Reserve interest rate hike.
- Core MoM Gain of 0.3% Highlights Sticky Underlying Inflation
- Shelter Reacceleration and Energy Price Drivers
- Complex Reactions in USD/JPY and Equity Markets
- Rate Pressures, Crypto, and Gold Dynamics
- Rising Odds of a Rate Hike at the September FOMC and Political Backdrop
- Key Indicators to Watch and Interbound US-Japan Policy Dynamics
Core MoM Gain of 0.3% Highlights Sticky Underlying Inflation
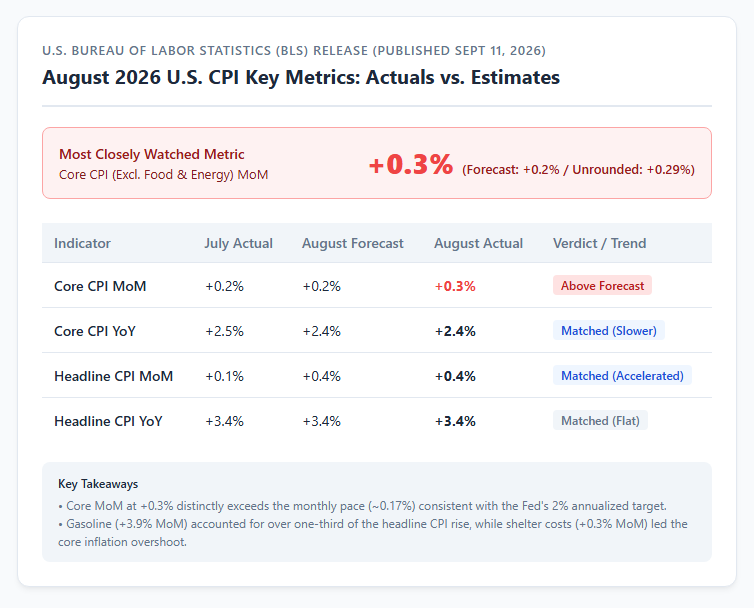
On September 11, 2026, the U.S. Bureau of Labor Statistics (BLS) published the August 2026 Consumer Price Index (CPI) report, presenting a mixed picture for financial markets. Headline CPI rose 3.4% year-over-year, matching July’s 3.4% rate as well as consensus expectations. On a month-over-month basis, headline CPI accelerated to 0.4% from July’s 0.1%, also landing precisely in line with forecasts. Meanwhile, core CPI—which excludes volatile food and energy components and commands the closest attention from financial markets—moderated slightly on an annual basis to 2.4% from July’s 2.5%, marking its lowest level since March 2021. However, the month-over-month core reading came in at 0.3% (0.29% unrounded), topping the market estimate of 0.2% by a tenth of a percentage point. Because this rate distinctly exceeds the monthly pace of roughly 0.17% required to align with the Fed’s 2% annualized target, it underscores that despite a long-term cooling in annual figures, underlying inflationary pressures remain stubbornly persistent.
Shelter Reacceleration and Energy Price Drivers
A granular breakdown of August inflation metrics reveals the key drivers behind the upside reading. Energy prices served as the primary catalyst pushing up headline CPI, surging 2.1% month-over-month. Gasoline prices alone jumped 3.9% in a single month, accounting for over one-third of the total monthly increase in headline inflation. Meanwhile, shelter costs—which carry a weight of over 30% in the overall CPI basket—proved to be the largest single factor driving the core CPI overshoot. Shelter inflation reaccelerated to 0.3% month-over-month after cooling to 0.1% in July. Although primary rent components, such as owners’ equivalent rent (OER), maintained a gradual downward trajectory, volatile sub-components like lodging away from home pulled the broader index higher. Furthermore, categorizing prices into goods and services reveals a stark contrast: while core goods inflation remained tame at 0.7% year-over-year, core services (including shelter) remained elevated at 3.0%. In addition, robust capital spending fueled by the artificial intelligence (AI) infrastructure boom continues to drive strong demand for hardware and software, exerting tangible upward pressure on consumer electronics prices.
Financial Market Volatility and Impact on Key Asset Classes
Complex Reactions in USD/JPY and Equity Markets
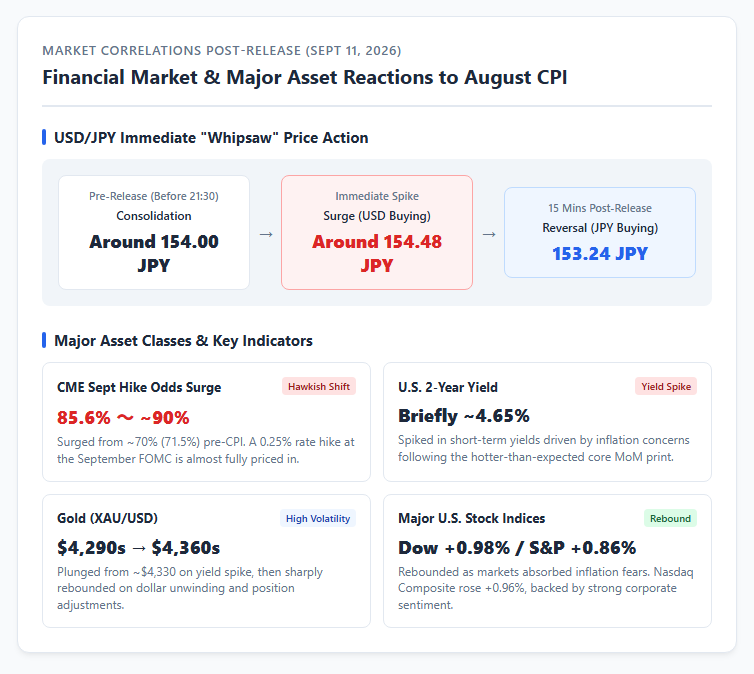
Immediately following the release, financial markets experienced sharp volatility as investors reacted to the hotter-than-expected month-over-month core figure. In foreign exchange, USD/JPY initially surged from around 154.00 toward 154.48 as rising rate-hike expectations prompted swift U.S. dollar buying. However, the rally proved short-lived; within roughly 15 minutes, the currency pair abruptly reversed course, dropping sharply to 153.24. This knee-jerk unwinding was driven by persistent demand for the Japanese yen, anchored by expectations that the Bank of Japan (BOJ) might hike interest rates at its upcoming monetary policy meeting on September 17–18. Conversely, major U.S. stock benchmarks—including the S&P 500, Nasdaq Composite, and Dow Jones Industrial Average—gradually staged a rebound despite the inflationary headline. Strong labor market fundamentals, corporate earnings resilience, and prior defensive positioning helped absorb the shock, though elevated long-term yields continue to pose a headwind for equity valuations.
Rate Pressures, Crypto, and Gold Dynamics
Fixed income markets saw pronounced selling pressure as inflation concerns mounted, driving the policy-sensitive U.S. 2-year Treasury yield up toward 4.65%. Surging yields weighed heavily on non-yielding assets: spot gold plunged immediately after the release to the \$4,290/oz range as higher yields triggered liquidations. However, as the dollar’s initial momentum faded, short-covering and position adjustment sparked a swift recovery, propelling gold back above pre-release levels to trade around \$4,360/oz. Risk assets like Bitcoin and broader cryptocurrencies similarly faced short-term headwinds, as prospects for prolonged monetary tightening limited immediate upside. According to analysis from Grayscale, while the stronger CPI print presents a temporary speed bump for digital assets, underlying market structure remains resilient, potentially offering an attractive entry point for investors who missed the preceding rally.
Federal Reserve Monetary Policy and Macroeconomic Outlook
Rising Odds of a Rate Hike at the September FOMC and Political Backdrop
Following the August CPI release, market attention has shifted squarely to the Federal Open Market Committee (FOMC) meeting scheduled for September 15–16, 2026. According to the CME FedWatch Tool, the implied probability of a 25-basis-point rate hike at the September meeting surged from roughly 70% prior to the data release to between 85% and nearly 90%. This leaves a rate increase—which would be the Fed’s first since July 2023—nearly fully priced in by market participants. During his August 28 address at the Jackson Hole symposium, Fed Chair Warsh explicitly signaled hawkish intent, stating that “if underlying inflation fails to progress clearly and sufficiently toward our 2% goal, we have work to do.” However, with November midterms approaching, the Trump administration has vocalized strong demands for rate cuts to stimulate economic growth. Should the Fed proceed with a rate hike, it risks sparking severe political friction with the White House, intensifying the tug-of-war over central bank independence and price stability.
Key Indicators to Watch and Interbound US-Japan Policy Dynamics
Assessing the future path of monetary policy requires looking beyond headline CPI to broader indicators, particularly the Personal Consumption Expenditures (PCE) price index, which serves as the Federal Reserve’s preferred inflation metric. Notably, the U.S. Bureau of Economic Analysis (BEA) is scheduled to release comprehensive methodological revisions to the PCE index on September 30, 2026, updating data models for software and portfolio management services, which could meaningfully alter baseline inflation assessments. From a global macroeconomic standpoint, central bank policy interactions are equally critical. Immediately following the FOMC decision, both the Bank of Japan and the Central Bank of the Republic of China (Taiwan) will hold their respective monetary policy meetings. Diverging or converging interest rate differentials between the U.S. and major Asian economies will heavily influence global capital flows. In Japan specifically, the interplay between Fed tightening and BOJ policy normalization expectations will serve as a decisive driver for FX rate trends and stock market direction.
Reference Pages
- [U.S. Bureau of Labor Statistics “Consumer Price Index — August 2026”] https://www.bls.gov/news.release/cpi.nr0.htm
【#USCPI #Inflation #Fed #FOMC #USDJPY #StockMarket #Crypto】

コメント