In September 2026, the U.S. Leading Economic Index came in flat at 0.0% compared to the previous month, beating market expectations of a 0.1% decline. This outcome was structurally supported by improvements in the yield curve spread and an increase in manufacturing hours worked, which helped prop up the economy, while being offset by a slowdown in consumer expectations.
- Index results and factors behind the better-than-expected improvement
- Analysis of Components and Structural Changes in the Economy
- US Dollar Buybacks and Movements of Major Currency Pairs in the Foreign Exchange Market
- Assessment of the Fed’s Monetary Policy and Recession Risks
- The Changing Balance Between Consumer Spending and Business Investment
- Future Outlook and Key Points
Index results and factors behind the better-than-expected improvement
According to the U.S. economic research organization The Conference Board on October 22, 2026, the U.S. Leading Economic Index (LEI) for September 2026 remained flat at 0.0% month-on-month. This outperformed the 0.1% decline in the previous month of August 2026 and the market consensus forecast of a 0.1% decline, showing an unexpected recovery. The overall level of the index recorded 99.6, and an upward revision of the historical data for July 2026 also contributed to the overall boost. According to Justyna Zabinska-La Monica, senior manager of business cycle indicators at the organization, the index is establishing a firmer footing than reported in the previous month. Please refer to the figure below.
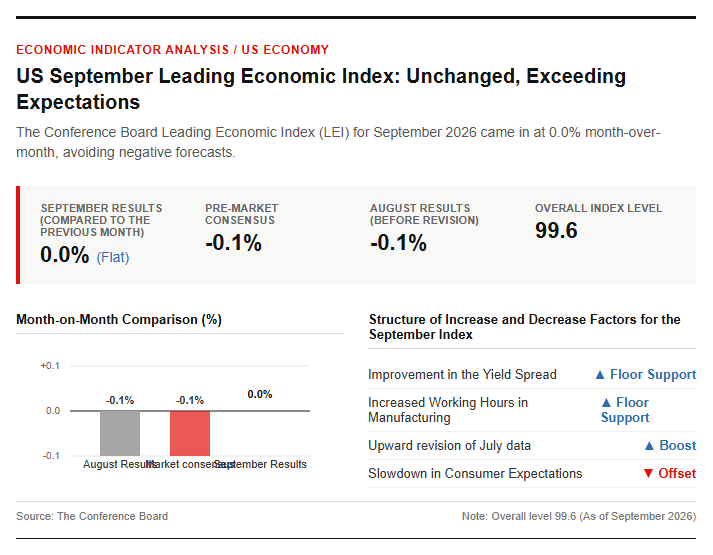
The latest results indicate that the U.S. economy is not immediately facing a rapid deterioration. The Leading Economic Index is a composite index designed to forecast future economic direction and turning points, and the halting of its decline was welcomed by the market as a factor easing the risk of an economic stall. However, continued vigilance is required given that it has remained at low levels below the baseline for the past 19 months. As for the real GDP growth outlook, while stable growth is projected at an annualized rate of 2.2% in 2026 and 2.0% in 2027, the economy remains in a complex environment with a tangle of downside and upside risks.
Analysis of Components and Structural Changes in the Economy
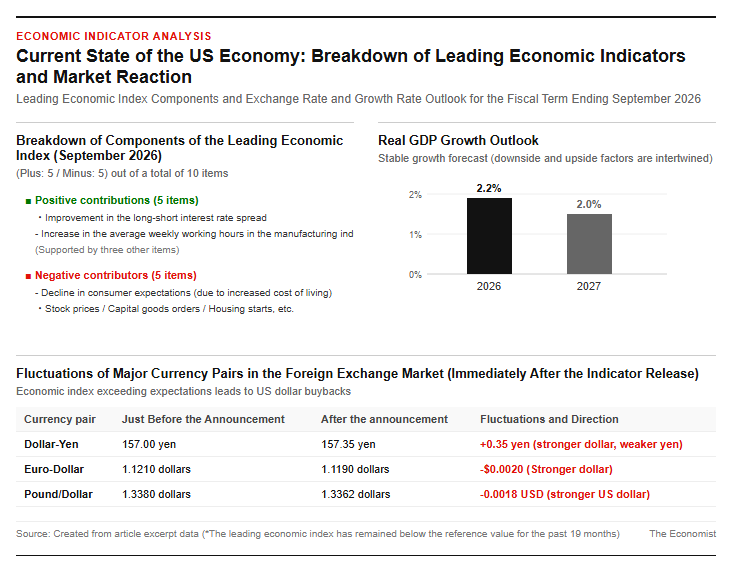
Of all the 10 components making up the leading economic index, 5 showed a positive contribution for the term of September 2026. The main drivers of the positive contribution were the improvement in the yield curve—indicated by the difference between 10-year government bonds and short-term interest rates—and an increase in average weekly hours worked in the manufacturing sector. The increase in working hours signifies that production activities at manufacturing sites are maintaining a certain level of robustness, serving as data that underpins the resilience of corporate activities.
On the other hand, a notable negative contributor that held down the rise of the overall index was a sharp decline in consumer expectations. The rising cost of living driven by stubbornly high prices for gasoline, food, and other items has thrown cold water on household sentiment, significantly weighing down forward-looking expectations. Furthermore, sluggish stock prices, declining new orders for capital goods, and lackluster growth in new housing building permits also acted as negative factors.
The important point that can be gleaned from this breakdown is that the driving force behind U.S. economic growth is shifting. Based on the growth rate trends over the past six months, a structural transition is underway: while reliance on personal consumption, which has strongly pulled the economy thus far, is decreasing, reliance on corporate capital investment and business activity is increasing.
Impact on Financial Markets and Trends in Foreign Exchange and Interest Rates
US Dollar Buybacks and Movements of Major Currency Pairs in the Foreign Exchange Market
Following the U.S. Leading Economic Index for September 2026 coming in above expectations and improving to flat, the foreign exchange market saw a progression of U.S. dollar buying. As concerns over an early slowdown in the U.S. economy that had spread prior to the release of the indicator eased, the data was perceived as a factor supporting the value of the U.S. dollar.
Specifically, in the US dollar-yen exchange rate, the dollar strengthened against the yen, moving from around 157.00 yen per dollar just before the announcement to 157.35 yen at one point. In addition, the US dollar was bought against European currencies, with the euro-dollar exchange rate falling from 1.1210 to 1.1190 dollars per euro, and the pound-dollar rate also shifting in favor of a stronger dollar, moving from 1.3380 to 1.3362 dollars per pound.
Behind these market reactions lies significant speculation surrounding the monetary policy decision at the upcoming Federal Open Market Committee (FOMC) meeting. Recently, expectations for a large-scale interest rate cut by the Federal Reserve (FRB) have been receding, while economic indicators avoiding downside surprises have restrained a sharp decline in U.S. yields. A growing view among market participants that the interest rate differential between Japan and the U.S. will not narrow rapidly has provided an incentive for short-term buying of the U.S. dollar.
Assessment of the Fed’s Monetary Policy and Recession Risks
The results of the latest leading economic index have once again highlighted the difficulty of policy navigation faced by the U.S. Federal Reserve (FRB) under the high-interest-rate environment. The spread between long- and short-term interest rates included in the leading index has historically attracted attention as a reliable signal for predicting U.S. recessions. In past examples such as the Great Depression of 1929, the 1973 oil shock, and the 2008 global financial crisis, shifts in the interest rate structure and the deterioration of leading indicators have historically been discussed as precursors to economic recessions. Please refer to the figure below.
In the current U.S. economy, upward surprises in the Consumer Price Index (CPI), an inflation indicator, and soaring energy prices continue, making it difficult for the Federal Reserve to pivot toward aggressive monetary easing anytime soon. While the fact that leading indicators have remained flat serves to rule out a sharp economic downturn, the risk that prolonged high interest rates will squeeze household finances through mortgages and auto loans still remains.
From the perspective of monetary policy, balancing the maintenance of price stability with an economic soft landing is the top priority. Going forward, the Fed is expected to very carefully assess the pace and timing of interest rate cuts while comprehensively taking into account various employment indicators, inflation expectations, and coincident economic indexes.
Future Economic Outlook and Impact on Investors
The Changing Balance Between Consumer Spending and Business Investment
The imbalance between personal consumption and business investment will be a crucial focus in predicting the future trajectory of the US economy. As shown in the breakdown of leading indicators, declining consumer expectations and deteriorating sentiment represent clear downside risks to future personal consumption expenditures. In the Conference Board Consumer Confidence Index for September 2026 as well, dissatisfaction with rising gasoline prices and high living costs reached record highs, and a trend of households curtailing their purchase plans for major durable goods and housing is being observed.
On the other hand, in the corporate sector, we are seeing the maintenance of average weekly hours and positive trends in capital investment, which are acting as a cushion to prevent a collapse of the overall economy. Up until now, personal consumption—accounting for roughly 70% of U.S. GDP—has been the primary driver of economic expansion, but going forward, the focus will be on the extent to which corporate investment and industrial activity can sustain the growth rate.
For investors, the selective screening of corporate performance will become even more critical. While a cautious stance is required for the retail and durable goods sectors that are directly impacted by the slowdown in consumption, attention is likely to grow toward manufacturing and technology infrastructure-related fields that can capture capital expenditure demand.
Future Outlook and Key Points
In the future trajectory of the U.S. economy, it is crucial to determine whether the flat movement of leading indicators is merely a temporary cessation of decline or a stepping stone toward a clear economic recovery. Market participants are focusing on the reality of personal consumption heading into the year-end shopping season, which is about to kick into high gear, as well as the trends in monetary policy meetings of the Fed and central banks around the world.
Key areas that warrant close attention include the following elements:
- Trends in US Price Indices (CPI and PPI) and Inflation Expectations
- Trends in Job Creation and Unemployment Rates in the Labor Market
- Movements in interest-rate-sensitive sectors such as housing permits and auto sales
- Policy rate decisions and announcements by central banks worldwide (FRB, BOJ, ECB)
In making future investment decisions, it is indispensable to conduct a multifaceted analysis that does not rely solely on “predictive signals” such as leading indicators, but instead combines them with coincident indicators, which show current economic activity, and lagging indicators, which reflect subsequent changes in employment and prices. Whether the U.S. economic scenario leads to a soft landing or heads toward a growth slowdown due to prolonged high interest rates, it is required to calmly track the trends of various economic data.
Reference page
- 【Economic Crises in the 20th century: Brief Review and Comparison】https://mpra.ub.uni-muenchen.de/122466/
【#US_Economy #LeadingEconomicIndicators #ConferenceBoard #ForexMarket #USDJPY #InterestRateTrends】


コメント