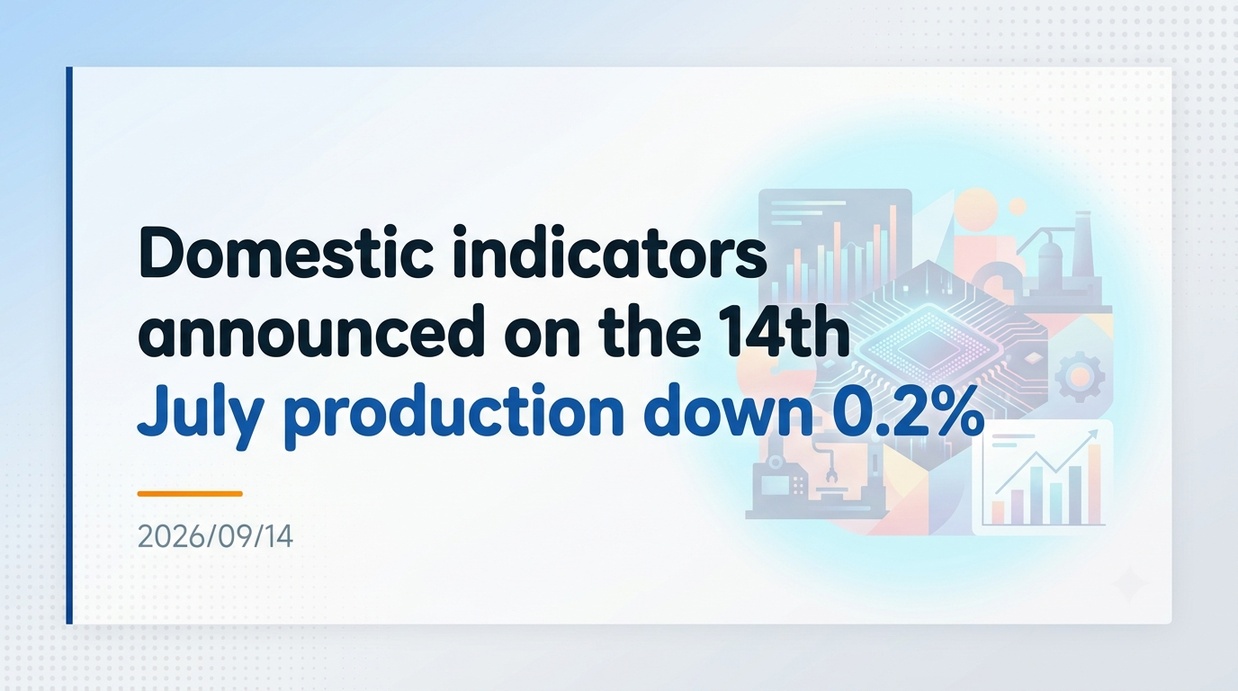
Japan’s revised industrial production index for July 2026 fell 0.2% month-on-month, revised downward from the preliminary estimate of a 0.1% increase, according to Ministry of Economy, Trade and Industry data released on September 14. While output in certain sectors was dampened by heightened Middle East tensions and rising raw material costs, solid demand for AI-related semiconductor manufacturing equipment continues to provide underlying support.
- Overview of Revised July Economic Indicators Revised Downward from Preliminary Figures
- Industry-by-Industry Performance and Key Product Trends
- Booming AI Demand and Machine Tool Orders Highlight Capital Spending Intentions
- Heightened Middle East Tensions and Elevated Commodity Costs Cloud Outlook
- Production Forecasts for August and September and Statistical Revision Dynamics
- Implications for Economic Indicators and Key Focus Areas
Overview of Revised July Economic Indicators Revised Downward from Preliminary Figures
According to revised data released by the Ministry of Economy, Trade and Industry (METI) at 1:30 PM on September 14, 2026, Japan’s Industrial Production Index for July 2026 (2020=100, seasonally adjusted) declined 0.2% month-on-month. This represents a downward revision of 0.3 percentage points from the preliminary reading of a 0.1% increase announced on August 31, underscoring sluggish momentum in manufacturing output. On a year-on-year basis, production rose 3.9%, also slowing slightly from the preliminary figure of 4.1%. Meanwhile, the Operating Capacity Index for July, released on the same day, logged a modest 0.5% month-on-month increase, marking a deceleration from preliminary expectations. METI maintained its official assessment that industrial production “fluctuates indecisively,” indicating that overall activity remains largely flat. The downward revision was driven by substantial output cuts in aircraft parts and fabricated metals, compounded by localized operational disruptions caused by summer typhoons and extreme heat waves. Please refer to the figure below.
Industry-by-Industry Performance and Key Product Trends
A breakdown by industry sector shows that out of 15 sectors, output rose in 10, fell in 4, and remained flat in 1. Production machinery led the expansion, surging 5.1% month-on-month to mark its second consecutive month of growth. Capitalizing on the global artificial intelligence (AI) investment boom, semiconductor manufacturing equipment jumped 10.7% month-on-month, while flat panel display (FPD) manufacturing equipment surged by an impressive 97.7%. Electronic parts and devices also expanded 2.6% month-on-month, boosted by a 53.1% spike in MOS ICs (memory). In addition, inorganic and organic chemicals rose 6.0% month-on-month, supported by rebounds in synthetic rubber (+21.7%) and polypropylene (+10.5%). Conversely, transport equipment (excluding motor vehicles) dropped 4.7% month-on-month due to reduced shipments of aircraft engine parts, while fabricated metal products fell 3.2% following declines in large structural components such as steel bridges, dragging down the overall index.
External Environment and Demand Trends Shaping Manufacturing
Booming AI Demand and Machine Tool Orders Highlight Capital Spending Intentions
The primary catalyst supporting domestic industrial output is the expanding global capital expenditure in AI and semiconductor supply chains. According to the Japan Machine Tool Builders’ Association (JMTBA), machine tool orders for August 2026 reached 197.8 billion yen (unadjusted), jumping 66.7% year-on-year to post double-digit growth for the twelfth consecutive month. This represents an all-time record for the month of August, with seasonally adjusted orders rising 9.0% month-on-month, pointing to robust structural growth. Domestic orders surged 61.6% year-on-year, while foreign demand expanded 65.8%, reflecting broad-based appetite across both domestic and international markets. Surging demand for data center infrastructure and semiconductor fabrication plants in the United States and China has significantly expanded order backlogs for Japanese machinery and component manufacturers. Please refer to the figure below.
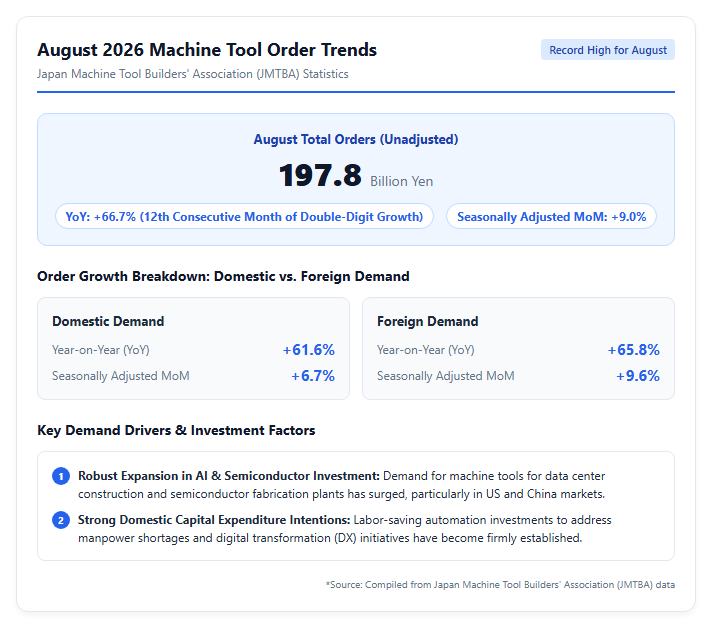
Furthermore, corporate capital investment remains elevated as manufacturers actively pursue labor-saving automation and digital transformation (DX) initiatives to alleviate ongoing labor shortages.
Heightened Middle East Tensions and Elevated Commodity Costs Cloud Outlook
A key downside risk to industrial production stems from geopolitical uncertainties in the Middle East and the associated surge in energy and raw material costs. As maritime disruption in the Strait of Hormuz persists, Japan’s average crude oil import price remained elevated between \$114 and \$115 per barrel as of July 2026. High oil prices directly inflate manufacturing costs for chemical products and plastics through price spikes in naphtha and heavy fuel oil. Additionally, escalating construction material and logistics expenses have caused procurement bottlenecks and project delays, weighing on domestic construction and capital spending progress. Furthermore, a major earthquake with a maximum seismic intensity of 7 that struck Kumamoto Prefecture on July 28, 2026, triggered temporary operational halts at local semiconductor and automotive facilities. Although manufacturers moved swiftly to restore operations, the broader impact on supply chain continuity warrants close monitoring.
Future Outlook and Broader Macroeconomic Impact
Production Forecasts for August and September and Statistical Revision Dynamics
According to METI’s Survey of Production Forecasts, manufacturing output is projected to rebound sharply by 6.4% month-on-month in August 2026 (or 3.1% when adjusted for historical forecast bias). Production increases are anticipated in 8 out of 11 sectors, led by gains in production machinery (+12.4%) and electrical machinery and information/communication electronics (+10.4%). However, a technical pullback of 4.2% is forecasted for September 2026, highlighting ongoing month-to-month volatility. Notably, following the 2020 base-year revision, the seasonal adjustment period for the Industrial Production Index was extended to 12 years, smoothing out irregular fluctuations and making underlying trends easier to discern. Consequently, assessing manufacturing health requires evaluating multi-month trends rather than focusing solely on single-month swings.
Implications for Economic Indicators and Key Focus Areas
Despite the downward revision in July’s industrial production, the Coincident Index of the Indexes of Business Conditions for July is projected by analysts, including Daiwa Institute of Research, to rise 1.6 points month-on-month to 120.1, keeping the official economic assessment at “improving.” Nevertheless, corporate price pass-through driven by rising import costs and stagnant real wage growth continue to weigh on private consumption. Expectation is growing that the Bank of Japan will raise its short-term policy rate to 1.25% at its October 2026 Monetary Policy Meeting, stoking concerns over the impact of rising interest rates on corporate and household debt-servicing burdens. Looking ahead, the key determinants of Japan’s economic recovery will be the sustainability of global AI demand, the stabilization of Middle East geopolitics, and the mitigation of inflationary commodity pressures.
Reference Pages
- [METI Industrial Production Statistics (Official Data)] https://www.meti.go.jp/statistics/tyo/iip/
- [Daiwa Institute of Research Economic Reports] https://www.dir.co.jp/
- [Dai-ichi Life Research Institute Macroeconomic Analysis] https://www.dlri.co.jp/
- [The Japan Research Institute Japan Economic Outlook] https://www.jri.co.jp/report/medium/japan/
- [The Tokyo Foundation Research Programs] https://www.tkfd.or.jp/research/detail.php?id=4306
【#IndustrialProduction #JapanEconomy #EconomicIndicators #Manufacturing #Semiconductors #BusinessTrends #CapitalExpenditure】

コメント