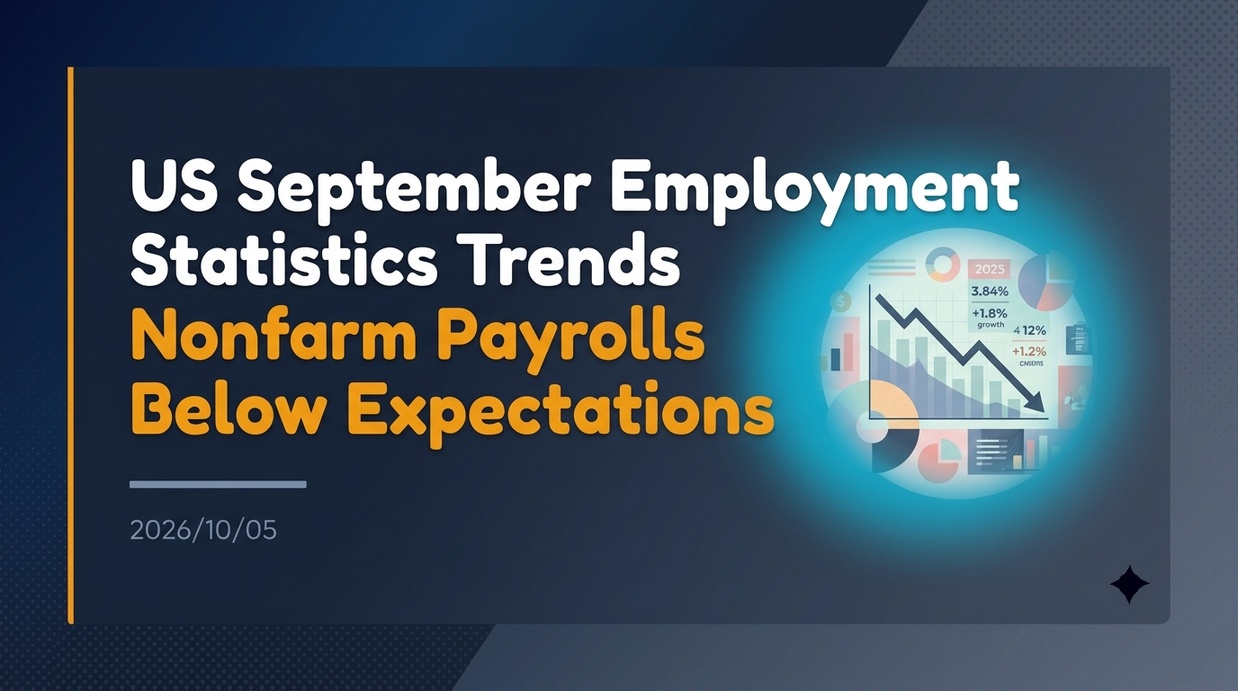
U.S. nonfarm payrolls in September 2026 increased by only 29,000 from the previous month, falling significantly short of the market expectation of a 90,000 increase. The unemployment rate also rose to 4.2%, which, along with the slowdown in wage growth, is having a major impact on the Federal Reserve’s monetary policy decisions and structural analysis of the U.S. labor market.
- The Shock of a 29,000 Increase in Non-Farm Payrolls and Trends in Key Indicators
- Mechanism of Historical Data Revision and the Background Behind the Widening Revision Range
- Changes in Monetary Policy Outlook and Expectations of an October FOMC Rate Hike Pause
- The Intersection of Volatility in Stock and Bond Markets and Inflation Concerns
- The Perspective of the Structural Labor Market Indicator (SLMI) Beyond the Unemployment Rate
- Estimation of Recession Risk and Key Points to Watch in the Future
The Shock of a 29,000 Increase in Non-Farm Payrolls and Trends in Key Indicators
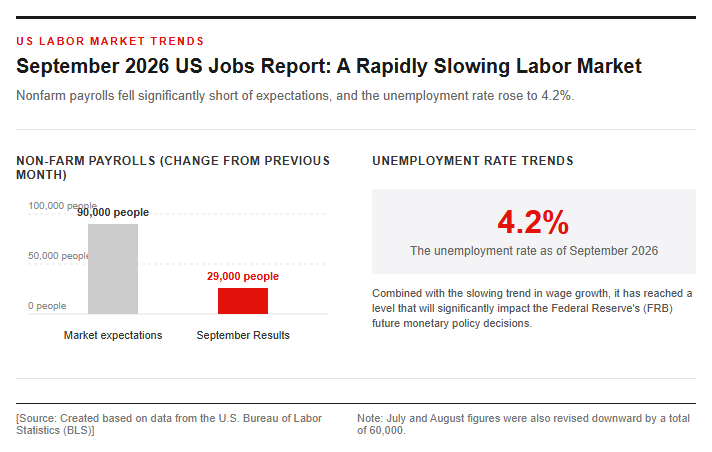
The September U.S. employment report released by the U.S. Bureau of Labor Statistics (BLS) on October 2, 2026, strongly highlighted a sharp slowdown in the labor market. Non-farm payroll employment, which sensitively reflects economic trends, increased by only 29,000 from the previous month, falling well short of pre-release market expectations of an increase of 88,000 to 90,000. Additionally, the employment figures for July and August were downwardly revised by a combined 60,000, showing that job growth has substantially lost momentum. The chart below shows the trends in the unemployment rate and non-farm payroll employment.
The trends in key indicators are as follows.
- Unemployment rate: Worsened by 0.1 percentage points from 4.1% in the previous month to 4.2%, reaching its highest level since May 2026.
- Average hourly earnings: +0.1% month-over-month (expected +0.3%) and +3.0% year-over-year (expected +3.1%), with the year-over-year growth slowing to a 5-year, 4-month low since May 2021 (+2.3%).
- Industry trends: Healthcare increased by 17,000, construction by 11,000, and manufacturing maintained positive growth with an increase of 9,000, while the financial sector declined by 7,000 and the government sector remained sluggish with a decrease of 17,000.
The latest statistics reflect a stagnation in hiring activity rather than a sudden surge in layoffs, indicating that companies are growing increasingly cautious about hiring in the face of rising energy prices and mounting costs.
Mechanism of Historical Data Revision and the Background Behind the Widening Revision Range
What market participants watched particularly closely in the September jobs report was the significant downward revision of employment figures for the previous two months (July and August). Specifically, July employment swung to a negative reading, shifting from an initially reported gain of 21,000 to a loss of 10,000, while August was also revised down from a gain of 162,000 to 133,000. This means a combined 60,000 job gains vanished over these two months alone, fundamentally altering perspectives on the growth pace of the U.S. economy.
Behind the revisions that occur in the monthly employment data published by the BLS lie structural characteristics of the data collection rate in the establishment survey.
- First release (1st announcement): The response rate from establishments as of the data cutoff remains at approximately 73%.
- Third Publication (3rd Announcement): Subsequent follow-up surveys raised the response rate to approximately 94.6%, updating the data to be more accurate.
- Reason for revision: If the employment status of establishments that failed to respond in time for the initial tabulation differs from that of the initial respondents, significant revisions to the figures will occur.
At economic turning points, employment restraint by small and medium-sized enterprises (SMEs) and others that are late in submitting their responses is often discovered later, and downward revisions like the recent one tend to become pronounced. Rather than relying solely on the surface-level figures of initial data, it is crucial to comprehensively understand the revision trends.
Impact on Financial Markets and the Fed’s Policy Decisions
Changes in Monetary Policy Outlook and Expectations of an October FOMC Rate Hike Pause
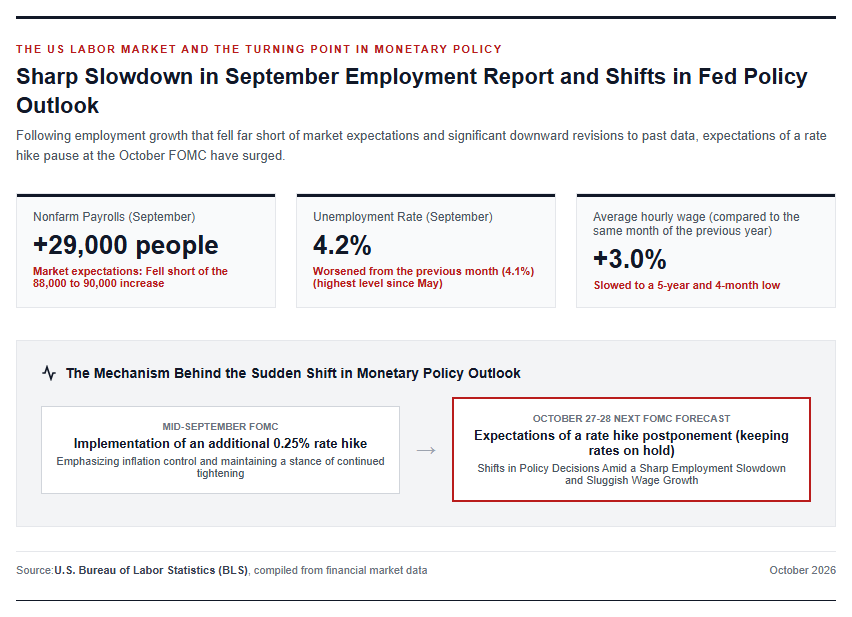
The US Federal Reserve (FRB) had just implemented an additional 0.25% rate hike at the Federal Open Market Committee (FOMC) meeting in September 2026, the first since July 2023. However, following a slowdown in job growth and a deceleration in wage growth in the September employment report, expectations rapidly gained momentum in financial markets that the FRB would forego another rate hike and hold policy rates steady at the upcoming FOMC meeting on October 27–28. The following figure is a conceptual diagram of interest rate outlooks and market reactions.
Market pricing regarding policy rates has changed as follows.
- Probability of a rate hike at the October FOMC: Fell significantly from the 23–24% range prior to the data release to 13–18%.
- Probability of a hold at the October FOMC: Surged rapidly from the 74–75% range before the announcement to over 80–81%.
- Actions at the December FOMC: The market estimates the probability of an additional rate hike at the December meeting to be approximately 75% to 86%, and a postponement of the rate hike decision is being factored in.
Top officials, including Federal Reserve Vice Chair Jefferson and New York Fed President Williams, are also advocating for a careful assessment of additional economic data. As JPMorgan Chief Economist Michael Feroli points out, the slowdown in wage growth gives the Fed reassurance, easing the need for aggressive further rate hikes.
The Intersection of Volatility in Stock and Bond Markets and Inflation Concerns
Immediately after the release of the September employment report, mixed price reactions were observed in financial markets. The softening of the labor market and the deceleration of wage growth were seen as factors that would reduce the pressure for monetary tightening by the Fed, leading to pre-market buying in the stock market, particularly centered around growth stocks and semiconductor-related shares. The S&P 500 and the tech-heavy Nasdaq 100 index performed solidly in pre-market trading.
However, in the bond market, volatile fluctuations occurred as a temporary bout of government bond buying (falling yields) was followed by selling pressure.
- 2-year yield: Briefly fell to 4.69% immediately after the announcement, but subsequently rebounded and traded in the 4.82% range.
- 10-year Treasury yield: Although it temporarily fell to the 5.15% range, it subsequently rebounded and rose to the 5.28% range.
- Market Background: Concerns over prolonged inflation driven by soaring energy prices, pressure from large-scale U.S. Treasury issuances, and the core PCE deflator continuing to exceed the 2% target at 3.0% year-over-year created upward pressure on yields.
Among market participants, the tailwind for equities known as “expectations of a rate hike pause due to a moderate employment slowdown” and the potential threat of “sticky inflation and economic slowdown risks” are intricately intertwined.
Structural Analysis of the Labor Market and Future Outlook
The Perspective of the Structural Labor Market Indicator (SLMI) Beyond the Unemployment Rate
While the unemployment rate came in at 4.2% in the latest employment report, there are limits to assessing overall labor market slack based solely on the surface-level unemployment rate figure. The “Structural Labor Market Indicator (SLMI),” proposed by Federal Reserve researchers (Cairo et al., 2026), is a theoretical framework developed to overcome the limitations of single-metric indicators.
The key features and analytical perspectives of SLMI are as follows.
- Integration of Multidimensional Indicators: Comprehensively analyzing nine labor margins—including not only the unemployment rate, but also employment, the labor force participation rate (61.8%), average weekly hours (34.4 hours per week), the job-to-applicant ratio, and real wages—using a New Keynesian DSGE model.
- Integration with macroeconomic variables: Incorporating information on real GDP growth and inflation rates (PCE and CPI) to identify structural shocks in labor demand and supply.
- Early Detection of Economic Turning Points: In historical data analysis, the SLMI has the characteristic of issuing deterioration signals earlier than a standalone unemployment rate in the early stages of a recession.
Even if the unemployment rate simply remains at a low level, if a decline in job openings or a reduction in working hours precedes it, the SLMI highlights a substantive softening of the labor market.
Estimation of Recession Risk and Key Points to Watch in the Future
A recent National Bureau of Economic Research (NBER) paper (Pascal Michaillat, 2025) features the latest Anticipation-Precision Frontier (APF) algorithm analysis, which evaluates real-time recession probabilities based on an ensemble classifier combining rising unemployment and falling job vacancy rates. The paper points out that due to the decline in job openings and the increase in job seekers since mid-2022, multiple classifiers have been triggered, and recession warning signals are flashing in the labor market.
Key points to watch regarding future U.S. economic and policy trends are as follows.
- Trends in inflation indicators: The September Consumer Price Index (CPI) and Producer Price Index (PPI) results, released ahead of the FOMC, will be the determining factors for the October policy decision.
- Geopolitical Risks and Energy Prices: If crude oil prices remain high due to ongoing tensions in the Middle East and other factors, the risk of stagflation (the coexistence of economic stagnation and inflation) will increase.
- Impact on the November U.S. midterm elections: The simultaneous progression of high inflation and a slowing labor market will heighten criticism of the administration and accelerate discussions on economic policy.
Whether the slowdown in the labor market remains a moderate adjustment toward a “soft landing” or marks the beginning of a “full-scale recession,” scrutinizing incoming data will be crucial.
Reference Page
- [The Employment Situation – September 2026] https://www.bls.gov/news.release/empsit.nr0.htm
- 【Beyond the Unemployment Rate: A Structural Labor Market Indicator – Federal Reserve】https://doi.org/10.17016/FEDS.2026.058
- 【Early and Accurate Recession Detection Using Classifiers on the Anticipation-Precision Frontier – NBER】 http://www.nber.org/papers/w34015
- 【Why are there revisions to the jobs numbers? – Bureau of Labor Statistics】http://www.bls.gov/opub/btn/volume-2/why-are-there-revisions-to-the-jobs-numbers.htm
[#USJobsReport #FRB #MonetaryPolicy #LaborMarket #USEconomy #Inflation #RateHikePause]


コメント